Over the past several months, we’ve highlighted the importance of explicit and standardized models in the context of equipment communications interfaces and some of the “smart” factory applications they support. The manufacturing stakeholders impacted by these applications run the gamut from process, equipment, maintenance, and industrial engineering to production operations to traceability regulatory compliance… yet these only scratch the surface.
The question you may be asking now is “So what?” or “What should I do with this information?” The answer to these important questions depends on your company and your role.
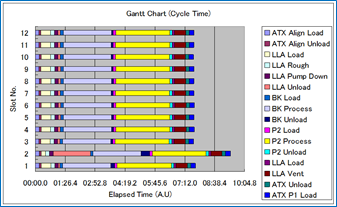
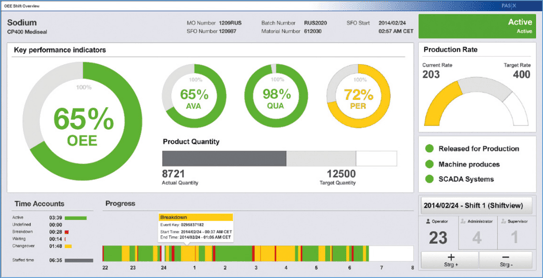
For example, if you’re part of a semiconductor manufacturing enterprise in today’s market environment, you know that you can probably sell every good device you make, so there is intense pressure to simultaneously maximize product quality, volume, and [factory and engineering] productivity–a perfect storm. Since lead times for new equipment needed for capacity expansion are at all-time highs, this means getting as much as you can out of your existing facilities while waiting for new deliveries. New applications to monitor and improve these KPIs are being developed continuously, but the one thing they have in common is a reliance on detailed, high quality, easily accessible and interpretable equipment data.
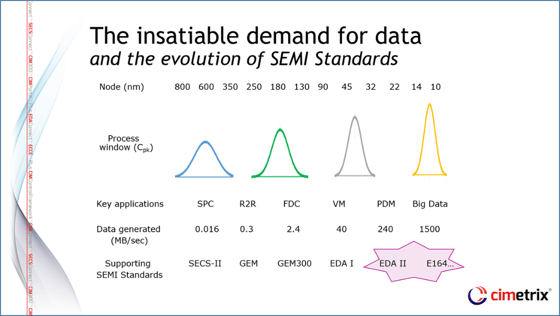
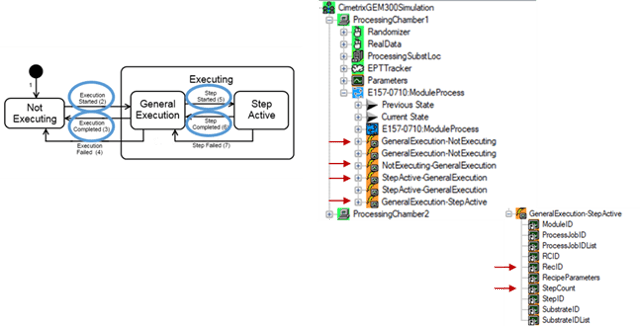
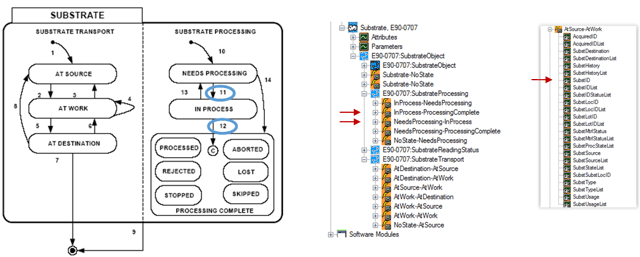
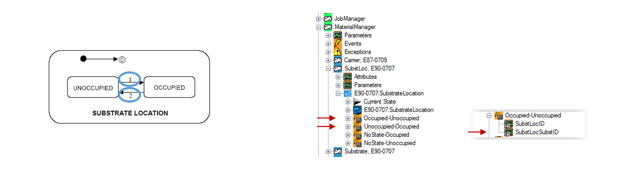
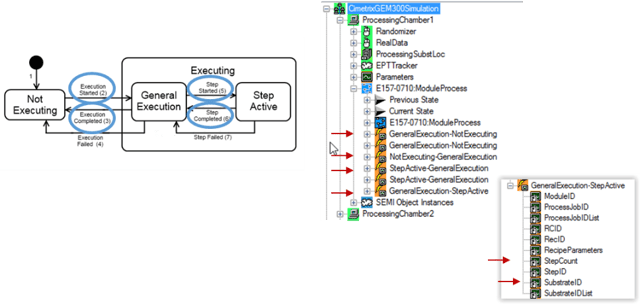
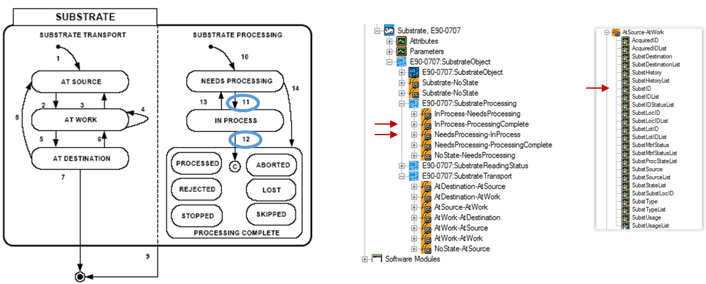
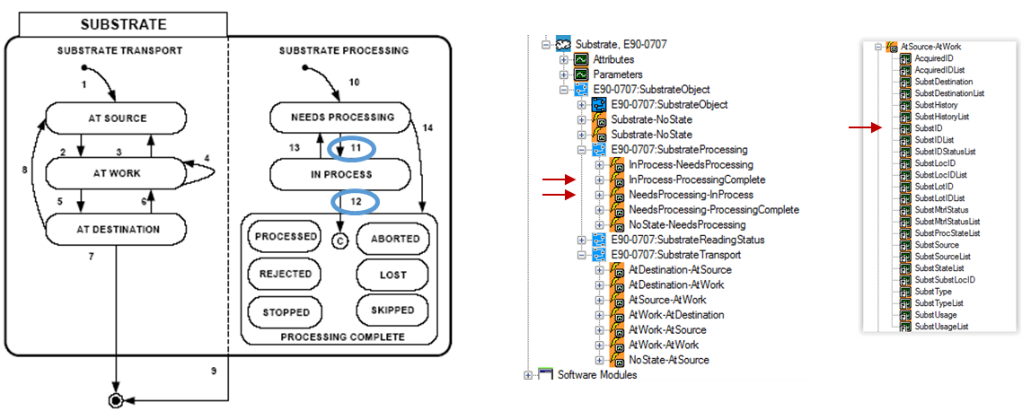
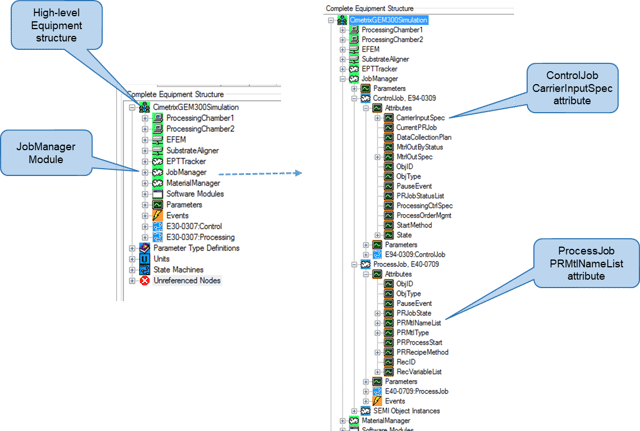
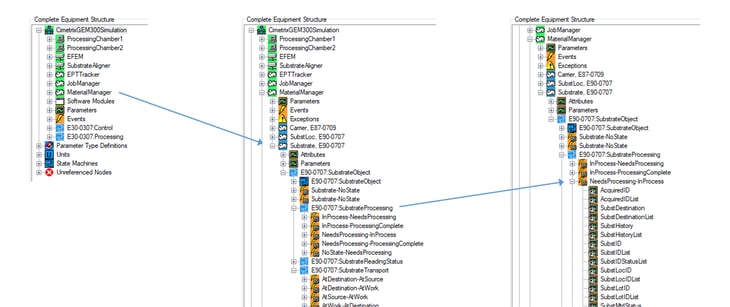
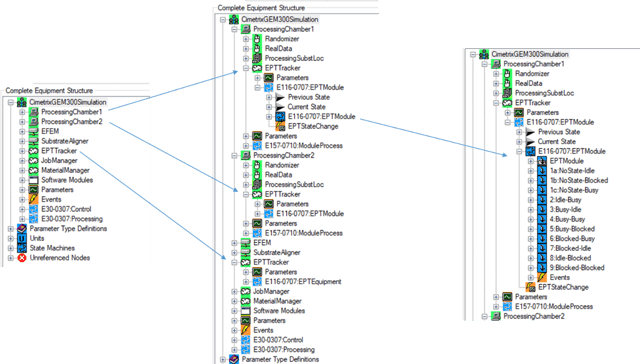
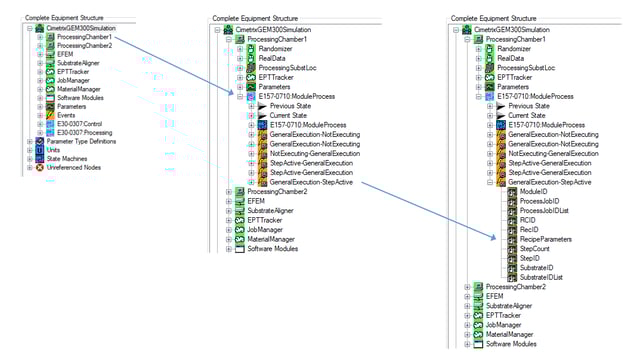
For 300mm equipment with the latest generation of SEMI EDA (Equipment Data Acquisition) interfaces, this means having “good” E120/E125/E164-compliant equipment metadata models as a foundation. On top of this foundation, however, the models must also include the specific parameters, events, state machines, and other items that fully describe the behavior of the equipment according to your unique manufacturing requirements… which can only be achieved by mapping these requirements into specific equipment model elements, and updating your purchase specifications to close whatever gaps you find between what is currently offered by the equipment suppliers and what you really need. Fortunately, we have been through this process a number of times, and can help clarify your manufacturing priorities and translate them directly into updated interface purchase specifications.
Admittedly, this may take some time, but remember that you always only get what you are willing to accept. It brings to mind the old adage: “The best time to plant a tree was 20 years ago; the second

best time is today.”
As another example, if you are part of the embedded control system development team of an equipment supplier, you can anticipate not only increasingly explicit model content requirements, but also more stringent performance and testing requirements for the standard EDA communications interface as your customers raise their reliance on this technology to realize manufacturing competitive differentiation. We at Cimetrix have seen this demand build over the past 18 months, and are well prepared to support you throughout the entire equipment development life cycle.
This article is the sixth and final in the series announced earlier this year in the Models in Smart Manufacturing blog series. From here, we’ll soon begin a new series on advanced EDA applications and benefits based on best practices of the industry leaders – be sure to watch for this early next year!
We look forward to your feedback and to sharing the Smart Manufacturing journey with you.
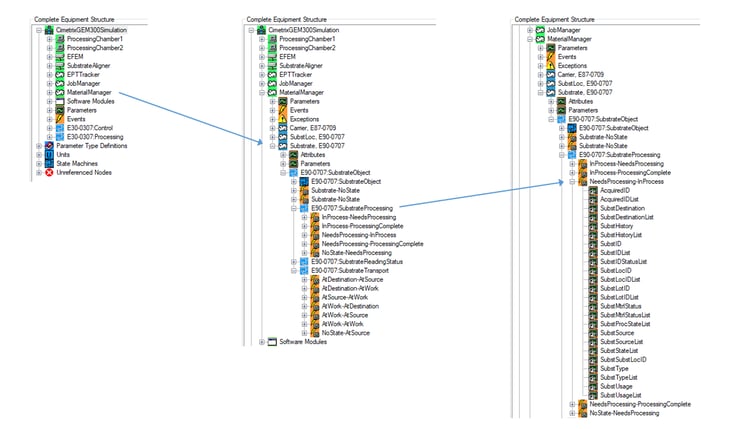
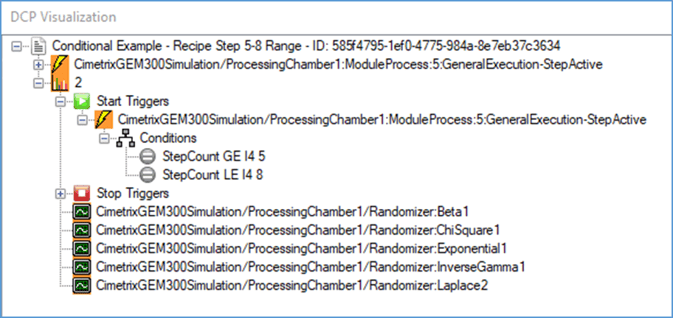
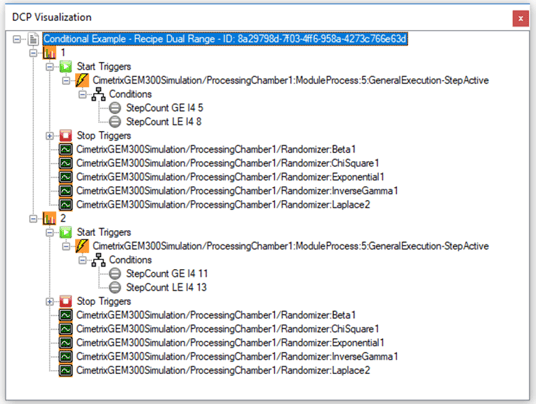
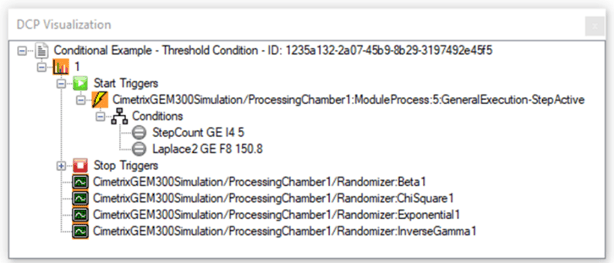
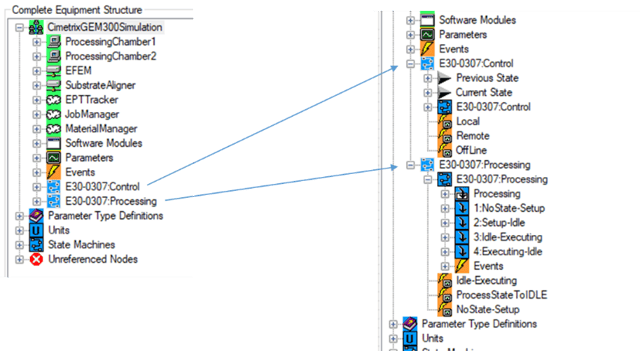
*The visualizations of equipment metadata model fragments are those produced by the Cimetrix ECCE Plus product (EDA Client Connection Emulator).

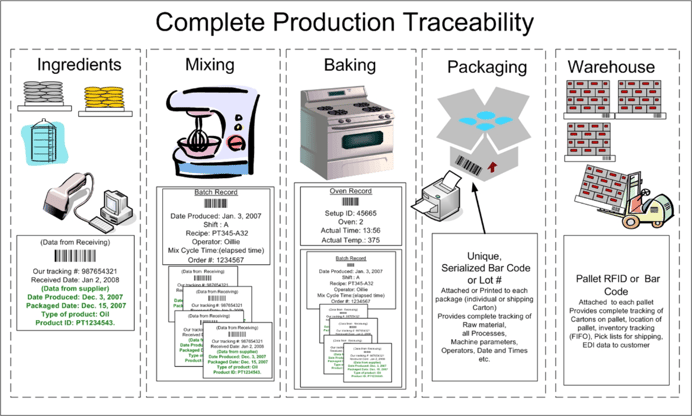
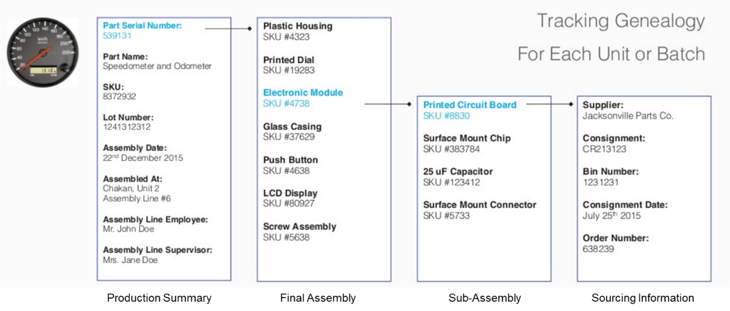
 …never mind which came first… do you know where the chicken and the egg came from?